
INTRODUCTION
A lock-in amplifier is a widespread detection system, used to extract the amplitude and the phase (R, θ) of a periodic signal even in presence of an intense background noise. Since its invention in the 1930s, the lock-in amplifier has become an indispensable tool in the fields of engineering, experimental and applied science. This instrument is in constant evolution since decades and is used in many laboratories and industries (as you can see from the links in the bibliography below).
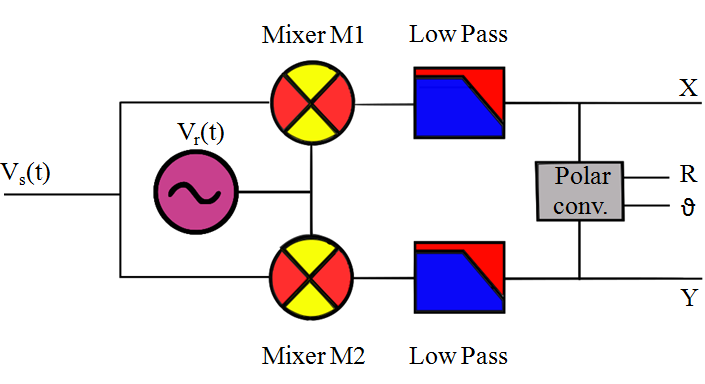
A schematic description of a lock-in system is shown below. The operator whishes to detect and measure a noisy input signal Vs(t) with a carrier frequency νs, using a reference signal Vr(t). By processing the input with a system of frequency mixers and low-pass (LP) filters, the amplifier rejects all the noise and retrieves the amplitude and phase of the desired signal.

An example of a real-life Vs(t) is the following. If the light output of a laser, switched on and off by a periodic gate signal, is conveyed to a dedicated sensor, the latter produces a proportional voltage which is sent to a lock-in amplifier as input. In technical jargon, the laser is the DUT (device under test) in such a scenario.
The fundamental idea of the lock-in technique is the orthogonality of sines and cosines oscillating at different frequencies. By exploiting this principle, the noise contributions are effectively removed from the signal’s spectrum. This amplifier performs two core operations:
-
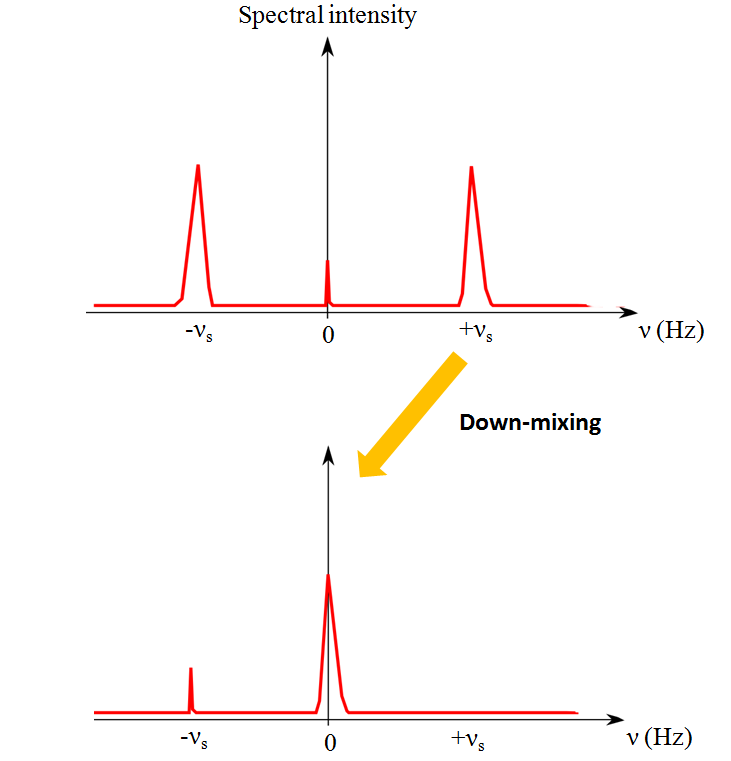
- Down-mixing
the input is multiplied by the reference signal which is either provided by an internal oscillator (homodyne detection) or by an external source (heterodyne detection).
-
- Demodulation
the resulting signal is filtered in an appropriate frequency bandwidth to exclude all noise and identify the carrier wave’s in-phase and quadrature components (X,Y). These are finally converted in polar coordinates as (R, θ).

DOWN-MIXING
The signal Vs(t) coming from the DUT is transmitted to the input channel of the amplifier. Let us assume it is a monochromatic wave with frequency νs and phase θ:

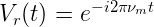
The reference Vr(t) signal can be chosen in different ways. Ideally a pure sine with a modulation frequency νm gives the highest selectivity, since it will discard all input components with ν≠νm. A common choice in real experiments is to exploit a periodic square wave from a function generator. As explained here, a square wave is the superposition of a fundamental sine and all its odd harmonics, therefore a lock-in using such a reference will detect the main frequency plus its odd multiples, introducing a systematic error in the measurement. For simplicity, let us consider a monochromatic reference
The lock-in splits the input signal Vs(t) in two channels, each connected to a frequency mixer where the reference signal is multiplied by each input copy. After the mixer M1, the resulting complex signal contains information about the in-phase component (X) of the signal:

Instead the mixer M2 operates with the signal and a 90°-phase shifted reference, to retrieve information on the quadrature component of the signal (Y):

In both cases, the reference signal is tuned properly in order to fulfill the matching condition:

so that the high-speed part of W(t) (rotating with frequency νs+νm) can be neglected. Therefore the down-mixing consists in subtracting the reference frequency from the signal one, resulting in a final ν as close as possible to 0, i.e. a new DC value.
DEMODULATION
Once the down-mixing is accomplished on both M1 and M2, hopefully with low signal loss and little channel mismatch, LP filters are used to extract the information shifted around 0 Hz.
If the frequency matching condition is not respected, then averaging (or integrating) over a time scale of few periods would give a zero value. This means that all possible noise contribution to the spectrum of the input signal will be discarded, leaving untouched the resonating wave only. This is why lock-in amplification is an example of synchronous detection.
Low-pass filtering of W(t) can be expressed as such average operation:

As discussed above, the oscillation at frequency (νm+νs) gives no contribution, while the rotation with (νm-νs) gives a non-zero average only for a perfect matching of the modulation and signal frequency. In this case, the result is

The in-phase and quadrature components are related to this complex value by:

An appropriate conversion from cartesian coordinates to polar ones gives the amplitude R and phase θ of the filtered input signal:

The function atan2 is defined as shown here and returns an angle in [-π, π]. These values are typically visible on the LED displays of the lock-in amplifier and can also be handled to a computer for further processing.
LP filtering acts isolating the down-mixed spectrum in a given bandwidth (BW) [-νBW,νBW]: a very narrow bandwidth improves the selectivity of the filter and suppresses the noise more efficiently. In the terms of Fourier analysis, this operation is described by the application of the filter’s transfer function H(ν) on the signal coming from the mixer:

The ideal transfer function works as a window, which just lets the spectral components in the bandwidth pass and cancels all the rest:

It is physically unfeasible to implement such a perfect gating filter, so different technological solutions have been developed to mimic this H(ν). LP filters based on a resistor and a capacitor (RC) are one of the simplest method, commonly exploited in analog lock-in amplifier. The picture shows a 1st-order (one-pole) RC filter.

The RC low-pass filter has the following transfer function:
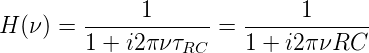
The time constant sets the cutoff frequency at which the intensity is reduced by 50% (i.e., -3dB):

For |ν|<ν-3dB, the amplitude and the phase of the input signal undergo a very small change while passing through the filter. Instead, for higher frequencies (|ν|>ν-3dB), the filter provides an attenuation of 20dB/decade and a larger phase shift.
A steeper attenuation is obtained by creating a system of n RC filter in series, so that the attenuation increases as 20 × n dB/decade and the cutoff becomes smaller, improving the selectivity of the filter. The overall transfer function becomes:
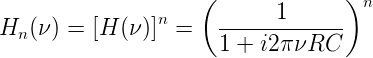
which also produces a larger phase delay for higher-order filters. The following Bode plots show the amplitude and the phase shift associated to different low-pass RC filters with fixed 1/τRC= 100 Hz and of order n=1, 2, 3, 4.

The design of the LP module is a result of the tradeoff between stronger attenuation, smaller bandwidth and larger phase alteration, depending on the specific purpose of the instrument. A direct proportionality between the bandwidth νBW and the cutoff frequency ν3dB exists, as defined by the particular filter architecture. However in our example of a monochromatic input Vs(t), the LP filter returns a demodulated signal extending in the spectral window [-ν-3dB,ν-3dB] :

Practical lock-in measurement are also characterized by the settling time τset for the data acquisition, i.e. the time for the measurement output to stabilize, and is often indicated as “time constant” on the front buttons of amplifier. It is defined as the time the lock-in needs to reach a stationary response to a step-like change of the input (for example, switching from 0 to 1) and measure meaningful values of amplitude and phase. One common convention is based on the time at which the filter response reaches 90% of the input. A direct proportionality between τset and the RC time constant τRC∼ 1/(ν-3dB) exists, as defined by the implemented filter. For example:
- 1st-order LP RC filter: τ90%= 2.3 τRC
- 4th-order LP RC filter: τ90%= 6.7 τRC
This indicates that the more the effective BW is reduced and the attenuation is increased by adding more cascaded RC filters, the longer it will take for the system to have a reliable measurement.
This is the end of my short introduction to the principles at the core of the lock-in amplifier. If you want to know more about the figures of merit of a lock-in system and how to deal with measurement noise, don’t miss my post on this topic!
Bibliography and interesting links:
White paper by Zurich Instruments (Nov 2016): “Principles of lock-in detection and the state of the art” https://www.zhinst.com/sites/default/files/li_primer/zi_whitepaper_principles_of_lock-in_detection.pdf
Outreach video by Zurich Instruments (Nov 2016): “Principles of Lock-in Detection”
https://www.youtube.com/watch?v=ZIjBRA2S0NQ
White paper by Stanford Research Systems (Nov 2011): “About Lock-in Amplifiers – Application note #3” https://www.thinksrs.com/downloads/pdfs/applicationnotes/AboutLIAs.pdf
George Greenwald, HUJI (Aug 2007): “The Lock-In Amplifier: Noise Reduction and Phase Sensitive Detection” http://old.phys.huji.ac.il/~greenwald/el_lab/labC/LockI.pdf
