

When performing an experiment to detect a physical phenomenon, it is very important that the measurement is “as clean as possible”, reducing any contributions to the signal coming from external interferences and noise.
As discussed in my post about the lock-in system fundamentals, lock-in detection is very effective to isolate even tiny (time-periodic) signal from noisy backgrounds. Of course, the use of a narrow bandwidth (BW) filter helps to reject unwanted noise, considering only the narrow spectral region around the carrier frequency of the signal. Unfortunately, this also implies a slower lock-in acquisition and consequently a poorer time resolution.
Therefore it is extremely important to understand the following points in an experiment:
- what are the noise sources affecting the measurement?
- how can we reduce noise and improve signal detection?
A variety of effects may introduce noise in a measurement, depending on the specific physical system which is investigated (mechanical, electromagnetic, superconducting, etc). Different types of noise have been discovered and classified in two large families: intrinsic noise (with a fundamental origin which cannot be completely suppressed from the measurement) and extrinsic noise (associated with external sources and typically easier to control).
Intrinsic types of noise are:
- thermal Johnson-Nyquist noise: it has a flat spectrum and contributes to the so-called “white noise”
- flicker or “pink” noise: it is dominant at low frequency due to its 1/ν-dependance (where ν is the frequency). It is often introduced by fluctuations in resistance or by vacuum tubes and semiconductors
- shot noise: it has a quantum origin, since it is due to the discrete nature of the charge carriers and may affect current measurement
Extrinsic noise may be labeled as asynchronous or synchronous (i.e., related to the reference signal of the lock-in amplifier).
- In the first case, we can think of electromagnetic interference from computers, WIFI, mobile or radio signals. Even mechanical vibrations (cooling and pumping systems, etc.) produce a temporal variation of the capacitance of the cables and alter the current flow, which is known as “microphone effect”.
- Synchronous noise may come from crosstalk between the experimental setup, the detector and the lock-in amplifier, when the noise source happens to match the reference frequency νm. In this case, even a highly selective filter cannot help because the noise is resonant with the signal.
The presence of parasitic capacitance may create capacitive coupling between the setup and the lock-in, while an alternating current (AC) in the cables may inductively couple via a varying magnetic flux. Finally, the presence of ground loops may alter the ground condition for the lock-in, the detector and the other parts of the setup, which could be an issue for the measurement.
Extrinsic noise can be minimized by carefully designing the experiment and its electrical connection, while the intrinsic noise is harder to reduce. If possible, the reference frequency should be chosen in order to be in the part of the spectrum where white noise dominates, avoiding the pink noise at low frequency.
Noise can be described in terms of its power spectral density, i.e. measuring how much noise is distributed at different frequencies within the operating spectral range of the experimental setup. The noise spectral power is measured as the function |VN(ν)|2 in units of V2/Hz, or using its square root |VN(ν)| in V/√Hz. For example, critical noise intensity is often revealed in many electronic systems at 50 Hz, which is the typical frequency of the AC power-lines in most of the world.
The overall quality of the measurement is then expressed by the Signal-to-Noise Ratio (SNR), i.e. the bare ratio between the useful signal power and the total noise power. Reducing noise, automatically the SNR is increased.
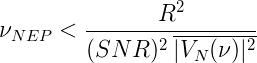
The quality of the measurement is also influenced by the Noise Equivalent Power (NEP) of the system, defined as the input signal power that results in an SNR of 1 in a 1 Hz output bandwidth. Essentially, the NEP gives the minimum detectable power per square root bandwidth for a detector, i.e. it indicates the weakest signal that can be detected.
Especially in noise measurement, the low-pass (LP) filter BW is often not specified in terms of ν-3dB (see here), but using a quantity indicated as νNEP. This is the cut-off frequency of an ideal brick-wall filter that transmits the same amount of flat noise as the filter we are setting. For cascaded RC filters, typically νNEP ≥ ν-3dB .
By knowing the signal amplitude R, the desired SNR value, the noise spectral power density |VN(ν)|2, one can consequently compute the needed NEP cut-off with the following relation:
The corresponding filter BW and settling time can then be retrieved and set on the lock-in system.
Another important figure of merit of a lock-in is the dynamic reserve, which is the ratio of the largest tolerable noise signal to the full-scale signal (expressed in dB), without causing any overload in any part of the instrument. Of course, this is a rather broad definition even because the overload risk can be reduced simply by setting a small gain at the input. Let’s consider a full scale of 3 μV and a dynamic reserve of 100 dB. Then a noise as large as 1e5 * 3 μV = 300 mV (100 dB larger than full scale) can be tolerated at the input without overload. An alternative definition of tolerable noise is: the noise level that does not affect the output more than a few percents of full scale, in a specific lock-in.
As discussed above, the noise at the reference frequency cannot be uncoupled from the signal, so it undergoes no attenuation and the dynamic reserve at νm is 0 dB. So measuring a laser’s pulsed signal should not be done with an electronic gating (or a mechanical chopping) at 50 Hz, since this would introduce an interference on the laser signal from the AC power-line. Instead for not resonating frequencies, the dynamic reserve increases since the LP filters suppress the noise components other than the signal. Therefore the dynamic reserve is strongly related to the cut-off of the LP filter and its attenuation at roll-off.
This review of the principles of noise control and the use of lock-in amplifiers ends here, but there will be occasions to further discuss the advent of digital technology in such an instrument.
Bibliography and interesting links:
White paper by Zurich Instruments (Nov 2016): “Principles of lock-in detection and the state of the art” https://www.zhinst.com/sites/default/files/li_primer/zi_whitepaper_principles_of_lock-in_detection.pdf
Outreach video by Zurich Instruments (Nov 2016): “Principles of Lock-in Detection”
https://www.youtube.com/watch?v=ZIjBRA2S0NQ
Application note by Stanford Research Systems (Nov 2011): “About Lock-in Amplifiers – Application note #3” https://www.thinksrs.com/downloads/pdfs/applicationnotes/AboutLIAs.pdf
Manual by Prof. George Greenwald, HUJI (Aug 2007): “The Lock-In Amplifier: Noise Reduction and Phase Sensitive Detection” http://old.phys.huji.ac.il/~greenwald/el_lab/labC/LockI.pdf
Paper by C. Beenakker, C. Schoenenberger, “Quantum Shot Noise”, Physics Today 56, 5, 37 (2003); https://doi.org/10.1063/1.1583532
